Flood report
Mapped flood hazard in and around the study area: FEMA special flood hazard areas, meaning the 1% annual chance floodplain and the regulatory floodway, and other mapped flood-prone land.
A desk review of the record as it stood: not a field survey and not a modelled study.
- Map screen ran
- 2026-10-02T16:38:31+00:00
- Map layer
- FEMA flood hazard zones
Downloads
This report as a Word file, and the engine's own files for the whole run.
- This reportscottsville-screen-test-flood.docx · Word · 172 KB
- The engine's risk matrixRiskMatrix_Scottsville_Screen_Test.xlsx · Excel · 41 KB
- The engine's permit matrixPermittingMatrix_Scottsville_Screen_Test.docx · Word · 41 KB
1Finding
This project is a map screen only. No row of the risk matrix was rated, so this report gives no rating; what the screen measured is set out under Map screening.
2What the record shows
No data-room documents were reviewed for this report. The project is a map screen only: its record is the screen's measurements, set out under Map screening.
3Map screening
The project boundary screened against public map layers. The figures are the engine's measurements as it recorded them, with each layer's status and notes.
The boundary
- Acres
- 713.79
- Perimeter in miles
- 4.11
- Boundary document
- DR-0001 · Project Boundary
- Rule
- only polygon document, single feature
- Mirrors allowed
- Yes
- Required layers that failed
- None
- Accepted gaps
- None
- Ran at
- 2026-10-02T16:38:31+00:00
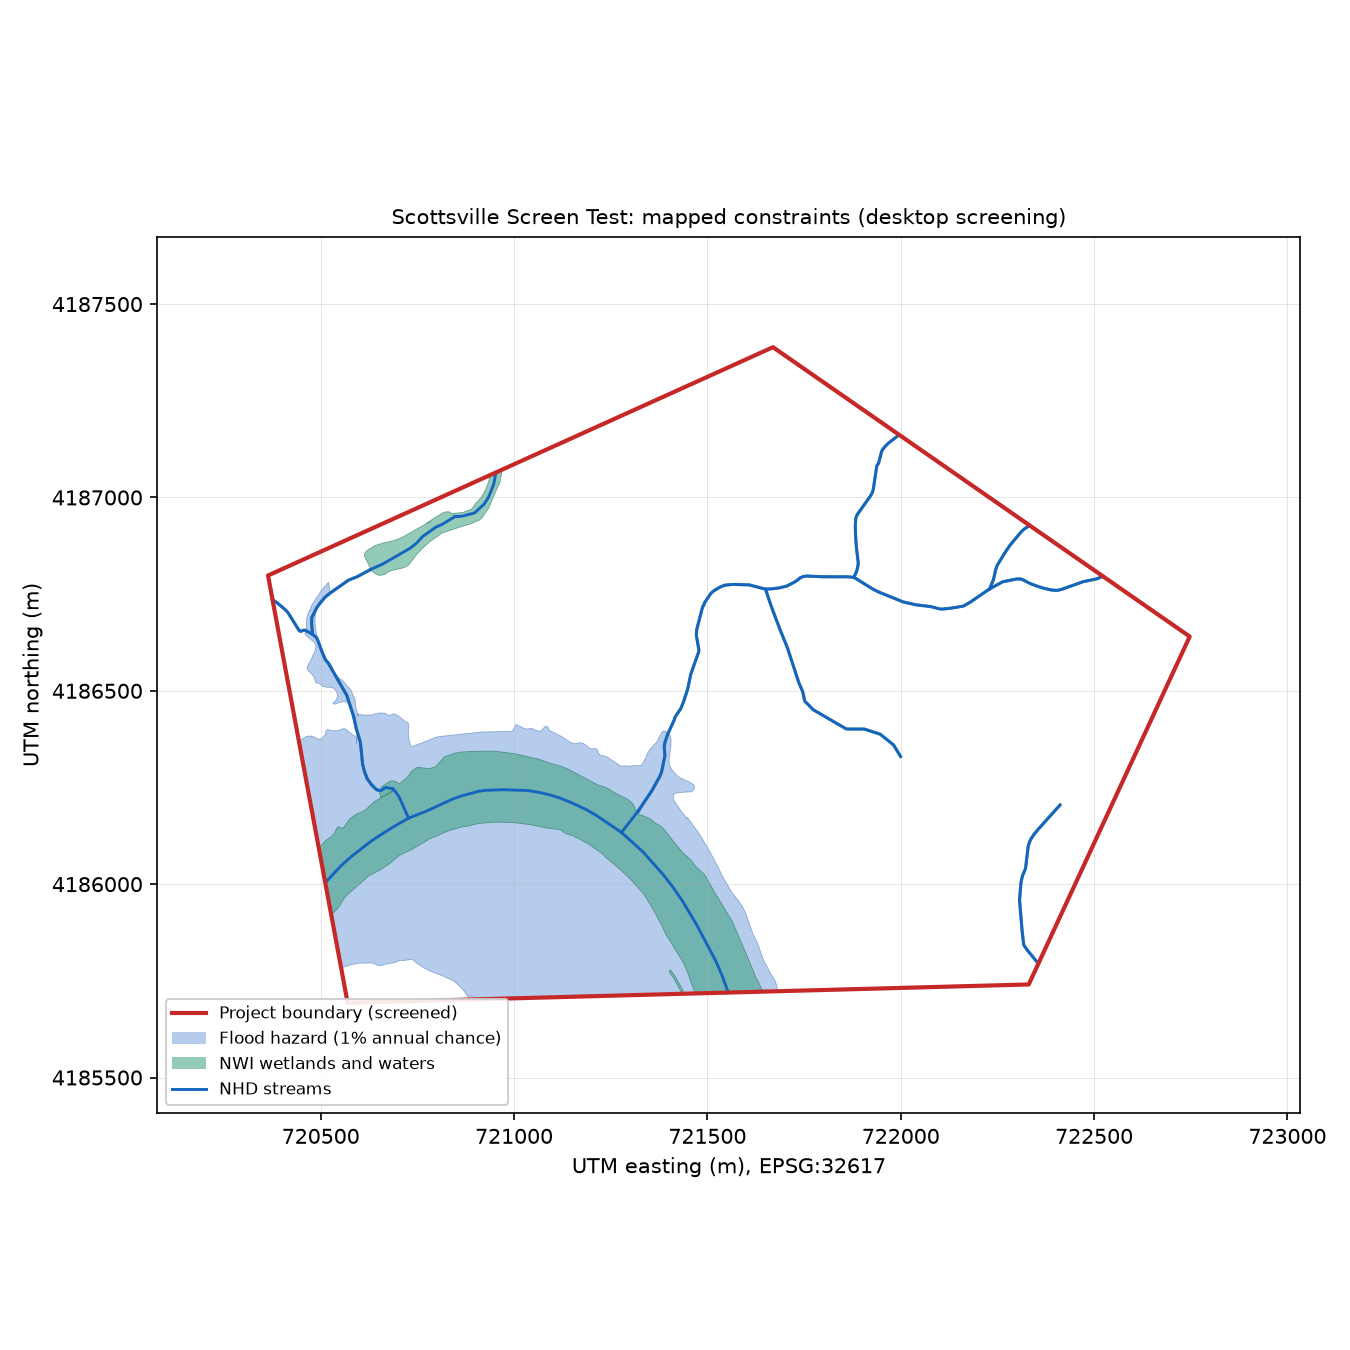
FEMA flood hazard zones
fema_flood
- Status
- partial
- Authoritative source
- No
- Exists only as today's version
- Yes
- Findings
- 4
- Notes
- Authoritative FEMA service unreachable (service metadata https://hazards.fema.gov/arcgis/rest/services/public/NFHL/MapServer: SSLError: HTTPSConnectionPool(host); used the Esri Living Atlas copy.
- The mirror omits minimal-hazard Zone X areas; digital map coverage cannot be measured from it.
- FIRM panel effective dates are not available from the mirror; the as-of status of the flood map cannot be confirmed from this source.
- Metrics
- acres_by_zone
- AE
- 27.12
- AE (Floodway)
- 143.78
- X (0.2 Percent Annual Chance Flood Hazard)
- 4.44
- X (Area With Reduced Flood Risk Due To Levee)
- 13.93
- sfha_acres
- 170.9
- floodway_acres
- 143.78
- x_0_2pct_acres
- 4.44
- digital_coverage_ratio
- 0.2652
4Permits and requirements
A map screen does not assess permits or requirements, so none are listed.
5What is missing
A map screen raises no information requests. Each layer's status and notes, under Map screening, say where its data fell short.
6Next steps and agencies
A map screen gives no next steps or agencies.
7Basis and limits
This report is a desk review of the public map layers named above, screened on 2026-10-02T16:38:31+00:00. No data-room documents were reviewed, and the screen records no information cut-off.
It is not a field survey and not a modelled study: this review made no site visit and ran no acoustic, hydraulic or other model. Where the record is silent, the report says what is missing; it does not fill the gap.
Every statement, figure and quote is the engine's record as written. The headings and connecting words are fixed text of this room, the same in every report.
Versions and data hashes
As the engine and the exporter recorded them. Hashes are SHA-256.
- Screen record
- 5e21f0c14267b833bd3f862e230da65829a9ba160a167c6fe009eb63cca69c17
- Map image
- 216a5478c8b3c19a452788afee691d150cf59c85bb420db616c586d12094e6bd
- Boundary geometry
- 9a467b459c29c0c77a52b7bf3fc74ac342c83f06fca792a5036cdab6c0eefa80
- Exporter
- Prism/room/exporter 1.4.0
Prism desk report · map screen ran 2026-10-02T16:38:31+00:00 · no engine version, prompt version or cut-off recorded